
TL;DR
Learning how to read data & work with data in Python wasn’t hard (thanks to the powerful pandas library), however, cleanly glueing Python analytics code together was. My goal of creating a reproducible building energy model wasn’t rocket science. But it sometimes felt like it.
The original version of this blog post was published on ploomber.io on 2022-01-22, however, I have since rewritten & expanded upon this experience here
Over 2020/21 I was at working at Codema on the Dublin Region Energy Masterplan.
I wanted to combine several publicly available datasets to (rudimentarily) estimate Dublin energy demand & visualise some insights. I wanted anyone to be able to run the models used & challenge the model assumptions. I wanted the work to be the foundation of more work to come.
Our aim was to estimate energy demand in as bottom-up a manner as possible so that we could match local demand to local renewables (wind or solar) under local contraints (urban planning, electricity grid, gas grid).
The end result - codema-dev/projects
Achieving this in practice was hard.
Why?
Table of Contents
Tools?
The prior model had been implemented in Excel.
It used a ~1GB dataset of building energy ratings as an input, which was big enough to crash Excel. So the original dataset was split into multiple smaller datasets, & with the help of a plugin, these were combined together. The model coupled data & logic, so every time the underlying dataset was updated these manual data transformation steps had to be repeated.
What do I mean by coupling data & logic? Say I have a sheet in
Excelwhere column A containsdistance (m)& column B containstime (s)& I want to findvelocity (m/s). I might …
- Create a third column called
velocity (m/s)- Specify in cell C1
= A1 / B1- Drag & drop this cell to the same length as the prior two columns
… & tada I have velocities. What if I want to calculate
velocity (m/s)in another workbook? I copy acrossdistance (m)&time (s)& repeat the same steps.
So fearing manual, repetitive work, I ruled out Excel.
What else could I use?
I needed something that was …
- Easy to use
- Easy to install
- Easy to build on
- Freely available
- Powerful - so it could be scaled to larger datasets than we could handle in
Excel
I landed on Python (owing to the pandas library) which hit 4, 5 & theoretically 3. I had no prior Python experience, though I had used C++ & MATLAB at a very basic level in university.
pandasis an open source data analysis and manipulation tool, built on top of thePythonprogramming language.
This switch didn’t come for free.
Excel is constrained. Python isn’t.
It’s easy with the benefit of hindsight to see how a wealth of tooling can easily distract from the problem at hand. How to define good enough?
- Who needs to use the code? What is reasonable to expect from them? How to share a cross-platform developer environment they can use?
- How do I version the code?
- Do I need to “unit test” the code? If so, how do I run the tests on code changes?
- How do I create an interactive application for visualising outputs? Should it be a web, desktop or mobile application? Where should it run?
Unit tests are code that checks code does what it was designed to do
Contrast that with sharing an Excel spreadsheet. It’s easy to use without much prior knowledge & widely available.
Does this power justify the additional complexity?
Downloading data?
We were working with several datasets -
| Data | Source | Accessible? |
|---|---|---|
| Building Energy Ratings (BER) | SEAI | Hidden Behind a Login |
| Annual Gas Consumption | Central Statistics Office (CSO) | Publicly Available |
| Small Area Census Statistics | Central Statistics Office (CSO) | Publicly Available |
| High, Medium & Low Voltage Electricity Grid Map | ESB | Available Upon Request |
| Gas Grid Map | Gas Neworks Ireland (GNI) | Available Upon Request |
| Dublin County ShapeFile | Shane McGuinness | Publicly Available |
| Emissions Trading Scheme (ETS) Emissions | Environmental Protection Agency (EPA) | Publicly Available |
Where possible I wanted to automate all data access, so that I could automatically update to the latest data.
Achieving this in practice was tough, since not all data was cleanly accessible …
One pesky dataset - the BER dataset - was hidden behind a login.
Following (what I understood as) the advice on StackOverFlow, I decided it would be a good idea to automate a browser to …
- Login using a previously validated email address
- Find a dataset link on the subsequent pages
- Download it from the link
Selenium - the browser automation tool - let me do this for the small price of …
- Installing a
Seleniumcompatable browser - Installing a
Seleniumdriver - Installing
Java
… & scripting instructions for the browser using its Python API, which calls into Java which calls into the browser?!
I eventually figured out that I could just login using the requests library using “sessions”.
A bit simpler.
Wrangling data?
By “wrangling” I mean loading & combining datasets
Now to process the datasets.
Surpisingly (for me), loading all of the text files via pandas was hard. If a dataset is really big or malformed in any way, you have to handle that complexity. For the BER dataset (again!) I had to fiddle with read_csv until I could get the damn thing to read -
- It’s around ~1GB in size so the default
read_csvcrashedpandassince I ran out of memory. I worked around this by manually decreasingpandasmemory usage using various hacks (dtypes,chunksizeetc) - The 800 thousandth line (or so) of the dataset had an issue - a string like
"blah"wasn’t escaped properly so it looked like"blah(which obviously breaks everything!) - so I had to specifyescapecharascsv.QUOTE_NONE
A rough start.
I didn’t have an off-the-shelf open-source building energy demand model that fit this use case (i.e. hundreds of thousands of buildings) to estimate energy demands (and Building Energy Ratings) from individual building characteristics like dimensions, U-values, boiler efficiencies etc, so I wrote my own model called codema-dev/rc-building-model based on the SEAI Building Energy Rating model Excel. To do so, I hunted spreadsheet calculations using “Find Relations” & translated each Excel step into Python1.
I used pandas, GeoPandas & numpy for loading & combining datasets & doing basic arithmetic (etc) on them.
This worked fine so long as the combined datasets (just about) fit into memory on my laptop! If I wanted to write analytics that didn’t would not be constrained by this, I was pointed towards a distributed computing tool like Dask or Spark which would require throwing out my code & rewrite it. These tools each bring their own, different complexities[^2] …
I didn’t like the arbitrary constraints imposed on me by
pandasso I started looking around. I resonated withfugue, which let me writePythononce & run it on various backends (likeDaskorSpark) without rewrites. I got involved in that project by helping them with their documentation & by giving a talk. I did not however, rewrite these data flows infuguesincepandas(mostly) did the job.
Visualising data?
Who is the target audience & how will they interact with the data? Will the visualisations live in pdfs, a desktop or web application, or Jupyter Notebooks?
Jupyter Notebookis aPythonapplication for interactive computing
pandas had decent “static” visualisation capabilities baked-in via DataFrame.plot for scatter plots, histograms, pie charts etc, & GeoPandas for “static” maps. Baking insights into images for pdfs is okay. Interactive visualisations are better.
Without needing to know any web development I figured out how to …
- Use
bokehto bake fairly crude interactive maps into a staticHTMLfile, which I could then share on a “static” website - freely hosted onGitHub Pages. - Use
streamlitto create an interactive data explorer web application - freely hosted on thestreamlitplatform on a server with fairly low memory & CPU.
bokeh was really easy to use, however, if it didn’t support a particular “thing” it was really hard to figure out how to do it since the framework abstracts away a lot of complexity. I remember spending ages trying to figure out how to access points on a map selected via “lasso” select. The solution was somewhat inaccessible to me since it involved dropping into the JavaScript language with which I wasn’t familiar at the time.
streamlit was exciting. By adding only a few lines of code it converted our Python functions into an interactive web application. It was much more powerful being able to combine Python functions than working with a “static” visualisation. Without too much effort I was able to use it to wrap the building energy model code to produce interactive visualisations at codema-dev/dublin-energy-app. Even still, this wasn’t smooth, since pandas struggled on the limited free-tier resources.
I also tried to create a desktop application to enable using a laptop’s resources to process data etc. I got a basic application running via chriskiehl/Gooey but I found packaging & sharing it via pyinstaller or indygreg/PyOxidizer too hard & the resulting executables too big.
Gluing Python functions together?
To make the whole process reproducible we have to automate downloading, wrangling & visualisation of the datasets.
I started off running code using Jupyter Notebooks since that’s how I initially learned pandas. Bit by bit the notebook grew in size, until eventually it took a long time to run & broke on the most minor of changes. So I broke it into multiple notebooks, but then I had to figure out how to combine them.
In my struggle I found Joel Grus - I don’t like notebooks which pushed me towards
Pythonfunctions.I later found Jeremy Howard - I really like notebooks which counters Joel Gru’s complaints, & proposes
nbdevas a tool to enable notebook-driven software development.
I could run a Python script which calls multiple functions, which is not that different from a giant notebook, but at least enabled “unit testing” the functions via pytest so I could be (somewhat) sure that a particular thing did what it was designed to do. But now I had to learn pytest. Obviously I wanted to run these checks every time the code changed, so I had to figure out GitHub Actions too.
I wanted a way to link all of the analytics functions together so that …
- If the data that hasn’t changed the corresponding functions won’t be rerun
- If a function fails I’ll know about it & understand why
I first found prefect. I really enjoyed the error messages it provided on failures & its ability to cache data & skip steps, however, my own team was not comfortable in Python. So I switched to ploomber. It was configurable without code (via yaml) so it felt a more natural fit. It enabled the team to just edit a configuration file to change or update high-level aspects of the pipeline like data source URLs.
Tracking changes?
Now that I was writing “professional” code, I had to use “professional” tools for saving & versioning it. With the power of git I could save a message alongside source code changes to make it easier to roll back to prior versions - provided that the messages were useful! Comparatively, in something like Microsoft Word or Google Docs I can only rely on timestamps like “March 14, 2022, 7:26 PM”.
Simple. Right?
No. Not really. Not at all.
In spite of the fact that git is everywhere, it’s famously hard to get started with & to mess up. I personally struggled to do really simple things, and I wasn’t alone - ohshitgit.
Having said that, it did eventually grow on me after I developed a decent mental model thanks to …
… but I would still hesitate to recommend it to newbies unless they are sure that the ends justifies the means.
Sharing a developer environment?
I couldn’t make my mind up on how to share my Python environment, since I found Python packaging really hard.
 |
|---|
| xkcd.com |
I liked poetry but I couldn’t use it to manage all of my Python dependencies, since GeoPandas required a C-library called GDAL which was only installable via conda.
I liked conda but I didn’t like that …
- I couldn’t freeze the environment to a particular version using a lock file2. This meant that
condawould resolve to different versions if run a month later since it had to figure them out every time. This massively hinders reproducibility since code might break if it was built against a different version. - It didn’t play nicely with
setup.py&pyproject.toml3 so using it withpoetrywas painful.
I liked Docker because I could easily share the resulting environment (a Docker image) with others & it just ran without issues. It also worked well with GitPod for running in the cloud. Within Docker, I used poetry to install Python dependencies & apt for non-Python dependencies. I didn’t like packaging an entire operating system (in this case 250MB-1GB) to run a few Python scripts. It seemed overkill.
I ended up using both conda & Docker. Both could be used for sharing a local & a cloud-based environment depending on preference. Binder enabled sharing a cloud-based Jupyter Notebook via conda & GitPod a cloud-based Visual Studio Code editor via Docker.
Closing Remarks
If I had known how much I was biting off when I initially chose Python, I’m not sure I would have made the same decision again. I would certainly have dedicated more time finding out what my requirements were, how they could be met with existing tooling & (if possible) talking to others who have solved similar challenges.
Sometimes an engineers job can feel like one is constantly glueing things together that weren’t designed to fit together.
I have since found the Wolfram language & have bought an annual “Hobbyist” license. I’m amazed at how much the language handles for me once I pay for the privilege.
Compare downloading & reading a dataset …
-
In one line via
Wolfram…githubEvents = Import["https://api.github.com/events"] -
Versus 10 lines in via
Pythonbuiltin librariesurllib&json…import json from urllib.request import urlopen filename = "github-events.json" with urlopen('https://api.github.com/events') as r: with open(filename, "wb") as f: for chunk in r: f.write(chunk) with open(filename) as f: github_events = json.load(f)Or 8 lines via 3rd party
Pythonlibraries4
… & we can see that Wolfram is much “higher-level”.
It even has builtin functions for deploying interactive visualisations to the cloud in one line of code …
CloudDeploy[Manipulate[Plot[Sin[x (1 + a x)], {x, 0, 6}], {a, 0, 2}]]
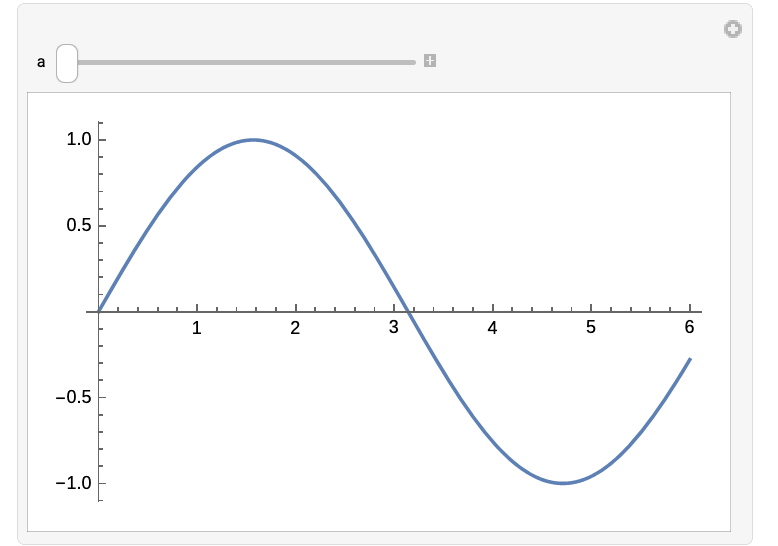 |
|---|
CloudDeploy Documentation |
With the advent of ChatGPT I find myself using it more & more for basic examples on how to combine various tool, since documentation on the intersection of tools is always scant.
In Wolfram I often don’t need to resort to this, since the documentation is so good. Each function comes with a number of “copy & pastable” examples of various use cases.
And if I do need it, Wolfram Notebooks already incorporates ChatGPT directly into its platform so I can run code locally generated by a “Large Language Model” on local data. It’s seamless.
Footnotes
-
I first tried dgorissen/pycel but couldn’t make it work with this spreadsheet. Even if I had managed this, it wouldn’t have generated a
numpybased model so wouldn’t have scaled well to thousands of buildings. ↩ -
conda/conda-locknow provides that missing lockfile ↩ -
I remember at the time that my workaroudn for installing a library was like
conda env create --name <env> --file environment.yml .& thenpip install --no-deps -e .↩ -
Via
requests&pandas…Install the dependencies into a virtual environment …
python -m venv .venv/
source .venv/bin/activate
pip install pandas requests
Download & read the dataset …
import pandas as pd
import requests

filename = "github-events.json"

r = requests.get('https://api.github.com/events', stream=True)
with open(filename, 'wb') as fd:
    for chunk in r.iter_content(chunk_size=128):
        fd.write(chunk)

github_events = pd.read_json(filename)